Saturday, June 25, 2011
CAVE NEWS MAGNETOSPHERE UPDATE - SATURDAY JUNE 25, 2011

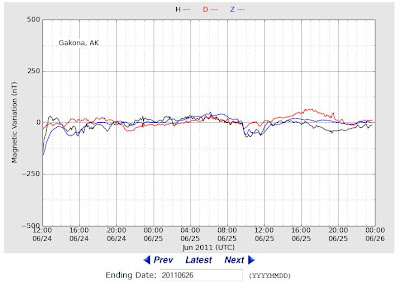
ALASKA'S HAARP FLUXGATE MAGNETOMETER
http://137.229.36.30/cgi-bin/magnetometer/gak-mag.cgi
FRIDAY, JUNE 24, 2011

SATURDAY, JUNE 25, 2011
EARTHQUAKE UPDATE

Latest Earthquakes Magnitude 2.5 or Greater in the United States and Adjacent Areas and Magnitude 4.5 or Greater in the Rest of the World - Last 7 days
Update time = Sun Jun 26 0:04:04 UTC 2011
| | MAG | UTC DATE-TIME y/m/d h:m:s | DEPTH km | Region |
|---|---|---|---|---|
| MAP | 4.7 | 2011/06/25 23:40:40 | 69.0 | MYANMAR |
| MAP | 2.5 | 2011/06/25 21:31:45 | 104.8 | SOUTHERN ALASKA |
| MAP | 5.7 | 2011/06/25 21:16:58 | 546.9 | SOUTH OF THE FIJI ISLANDS |
| MAP | 3.3 | 2011/06/25 18:36:11 | 5.2 | CENTRAL CALIFORNIA |
| MAP | 3.2 | 2011/06/25 15:36:10 | 101.0 | PUERTO RICO REGION |
| MAP | 4.6 | 2011/06/25 15:04:26 | 36.1 | NEAR THE EAST COAST OF HONSHU, JAPAN |
| MAP | 4.6 | 2011/06/25 13:04:58 | 100.0 | HOKKAIDO, JAPAN REGION |
| MAP | 3.5 | 2011/06/25 12:44:08 | 15.3 | FOX ISLANDS, ALEUTIAN ISLANDS, ALASKA |
| MAP | 2.6 | 2011/06/25 12:06:59 | 62.3 | CENTRAL ALASKA |
| MAP | 4.5 | 2011/06/25 11:34:19 | 307.9 | BANDA SEA |
| MAP | 4.5 | 2011/06/25 10:04:58 | 210.8 | FIJI REGION |
| MAP | 4.7 | 2011/06/25 09:59:32 | 62.7 | NEAR THE EAST COAST OF HONSHU, JAPAN |
| MAP | 2.8 | 2011/06/25 09:04:31 | 51.2 | FOX ISLANDS, ALEUTIAN ISLANDS, ALASKA |
| MAP | 3.3 | 2011/06/25 08:36:41 | 39.1 | FOX ISLANDS, ALEUTIAN ISLANDS, ALASKA |
| MAP | 4.3 | 2011/06/25 08:09:44 | 71.9 | FOX ISLANDS, ALEUTIAN ISLANDS, ALASKA |
| MAP | 2.7 | 2011/06/25 07:19:00 | 8.7 | SAN FRANCISCO BAY AREA, CALIFORNIA |
| MAP | 4.5 | 2011/06/25 07:06:07 | 35.0 | NEAR THE EAST COAST OF HONSHU, JAPAN |
| MAP | 2.6 | 2011/06/25 06:55:26 | 105.2 | SOUTHERN ALASKA |
| MAP | 4.7 | 2011/06/25 06:54:34 | 29.2 | OFF THE EAST COAST OF HONSHU, JAPAN |
| MAP | 2.6 | 2011/06/25 04:43:54 | 0.5 | NORTHERN CALIFORNIA |
| MAP | 3.1 | 2011/06/25 04:42:52 | 0.0 | NORTHERN CALIFORNIA |
| MAP | 2.5 | 2011/06/25 04:41:55 | 0.5 | NORTHERN CALIFORNIA |
| MAP | 2.9 | 2011/06/25 04:05:51 | 2.1 | NORTHERN CALIFORNIA |
| MAP | 5.1 | 2011/06/25 03:18:54 | 37.9 | MARIANA ISLANDS REGION |
| MAP | 3.0 | 2011/06/25 02:49:53 | 13.9 | BAJA CALIFORNIA, MEXICO |
| MAP | 4.8 | 2011/06/25 00:44:23 | 62.0 | EASTERN HONSHU, JAPAN |
| MAP | 4.2 | 2011/06/25 00:41:30 | 9.3 | QUERETARO, MEXICO |
| MAP | 3.1 | 2011/06/25 00:10:50 | 89.9 | PUERTO RICO REGION |

New Madrid Center for Earthquake Research and Information
RECENT CENTRAL STATES EARTHQUAKES
map 2.4  2011/06/25    8 km ( 5 mi) NNW of Maypearl, TX
map 2.3  2011/06/24   11 km ( 7 mi) N   of Camden, SC
SOLAR UPDATE


No CME Impact: As of this update at 22:00 UTC Friday, there has been no major CME impact detected. This CME has either yet to arrive or it could have missed earth outright.
Solar Update: New Sunspot 1241 was numbered on Friday and is located in the northern hemisphere. Sunspot 1236 is rotating towards the western limb and will soon be out of direct earth view. Solar activity is expected to continue at low levels in the short term.
MOON UPDATE

THE CAVE NEWS FLOODING UPDATE - Saturday June 25, 2011 (updated throughout the day)

REAL TIME RADIATION NETWORK
 ALERT LEVEL = 100 CPM
CPM = Counts Per Minute
Friday, June 24, 2011
US ARMY'S corp of engineers DAILY RESERVOIR CONTROL CENTER REPORT UPDATE
CAVE EDITOR'S NOTES:
US ARMY CORP OF ENGINEERS NEWS RELEASE
July 7, 2011 is scheduled for diversion through regulating tunnels to allow for routine inspection of spillway slabs at Ft. Randall Dam (dam upstream from Gavins Point)
Pickstown, S.D. —The U.S. Army Corps of Engineers invites the public to witness the diversion of surplus water out of Fort Randall Dam through the dam’s four regulating tunnels July 7, between 10 a.m. and 2 p.m.
“This is only the second time in history that such a high volume of water will be released through the regulating tunnels,” said Tom Curran, Fort Randall Dam operations manager.
The opening of the regulating tunnels will equate to a flow of approximately 120,000 cubic feet per second (cfs) through these 22-foot diameter pipes. The water will be diverted to allow for routine inspection of the spillway slab at the dam. The spillway slab is 40 acres of concrete with a thickness of 2 – 6 feet, used to carry water downstream and away from the spillway gates.
MONTHLY RESERVOIR OPERATION - MAY 2011 - PECK, GARRISON, OAHE, BIG BEN, FT. RANDALL, GAVINS POINT
FOLLOWING LINK UPDATES DAILY:
http://www.nwd-mr.usace.army.mil/rcc/reports/showrep.cgi?3MRDTAP7
June 27, 2011
JUNE 26, 2011

JUNE 25, 2011

JUNE 24, 2011

A guide assisting in reading this report:
- Under 'Project Information' are the capacities of each reservoir referring to the dam/reservoir's elevation above sea level.
- MP means the minimum power pool or a normal lake level- FC means flood control of the maximum height the reservoir can hold before water goes over the emergency spillways (called an "uncontrolled release").
- Current data shows the reservoirs actual level at the time of observation- acre-feet of the lake's surface- inflow to the lake/reservoir and discharge out the dam's control structures/spillway.
- The last figure in each project- probably the figure most telling- is the percentage of flood control capacity left in that particular reservoir/lake.

http://www.nwo.usace.army.mil/html/Lake_Proj/fortpeck/welcome.html
59600 cubic feet per second (cfs) June 24, 2011
60200 cubic feet per second (cfs) June 22, 2011
61800 cubic feet per second (cfs) June 21, 2011
percentage of flood control capacity left in that particular reservoir/lake 110.4% June 24, 2011
percentage of flood control capacity left in that particular reservoir/lake 112.9% June 22, 2011
percentage of flood control capacity left in that particular reservoir/lake 112.9% June 21, 2011
percentage of flood control capacity on JUNE 15, 2011 115.1%

http://www.nwo.usace.army.mil/html/Lake_Proj/garrison/welcome.html
150300 cubic feet per second (cfs) June 24, 2011
150400 cubic feet per second (cfs) June 22, 2011
150200 cubic feet per second (cfs) June 21, 2011
percentage of flood control capacity left in that particular reservoir/lake 103.0% June 24, 2011
percentage of flood control capacity left in that particular reservoir/lake 102.4% June 22, 2011
percentage of flood control capacity left in that particular reservoir/lake 101.0% June 21, 2011
percentage of flood control capacity on JUNE 15, 2011 98%

http://www.nwo.usace.army.mil/html/Lake_Proj/oahe/welcome.html
150400 cubic feet per second (cfs) June 24, 2011
153900 cubic feet per second (cfs) June 22, 2011
160300 cubic feet per second (cfs) June 21, 2011
percentage of flood control capacity left in that particular reservoir/lake 94.3% June 24, 2011
percentage of flood control capacity left in that particular reservoir/lake 92.7% June 22, 2011
percentage of flood control capacity left in that particular reservoir/lake 89.8% June 21, 2011
percentage of flood control capacity on JUNE 15, 2011 87.8

http://www.nwo.usace.army.mil/html/Lake_Proj/bigbend/welcome.html
165000 cubic feet per second (cfs) June 24, 2011
162900 cubic feet per second (cfs) June 22, 2011
162900 cubic feet per second (cfs) June 22, 2011
158900 cubic feet per second (cfs) June 21, 2011
percentage of flood control capacity left that particular reservoir/lake 47.0% June 22, 2011
percentage of flood control capacity left that particular reservoir/lake 31.7% June 22, 2011
percentage of flood control capacity left that particular reservoir/lake 0.0% June 21, 2011
percentage of flood control capacity on JUNE 15, 2011 0.0%

http://www.nwo.usace.army.mil/html/Lake_Proj/fortrandall/welcome.html
137800 cubic feet per second (cfs) June 24, 2011
139600 cubic feet per second (cfs) June 22, 2011
143500 cubic feet per second (cfs) June 21, 2011

percentage of flood control capacity left in that particular reservoir/lake 79.4% June 24, 2011
percentage of flood control capacity left in that particular reservoir/lake 68.7% June 22, 2011
percentage of flood control capacity left in that particular reservoir/lake 62.4% June 21, 2011
percentage of flood control capacity on JUNE 15, 2011 51.7%

http://www.nwo.usace.army.mil/html/Lake_Proj/gavinspoint/welcome.html
158500 cubic feet per second (cfs) June 24, 2011
150900 cubic feet per second (cfs) June 22, 2011
150000 cubic feet per second (cfs) June 21, 2011
percentage of flood control capacity left in that particular reservoir/lake 53.0% June 24, 2011
percentage of flood control capacity left in that particular reservoir/lake 62.8% June 22, 2011
percentage of flood control capacity left in that particular reservoir/lake 51.6% June 21, 2011
percentage of flood control capacity on JUNE 15, 2011 52.3
Thursday, June 23, 2011

Sioiux City Journal | Nuclear Plants Rumors Swirl

One of Nebraska's two nuclear power plants -- Fort Calhoun Station north of Omaha -- is surrounded by the Missouri River.
The other -- Cooper Nuclear Station near Brownville -- is close to shutting down because the Missouri River is rising to critical levels and pushing water over levees.
People are understandably nervous. They worry about a nuclear disaster like the one that occurred in Japan after an earthquake and tsunami in March.
And inaccurate information and rumors floating on the Internet are fueling the fear.
Joyce Riley's Power Hour News - Thursday June 23, 2011
Latest on flooding: June 23
FEMA questioned: U.S. senators from Nebraska, Iowa and South Dakota questioned Federal Emergency Management Agency boss Craig Fugate on Wednesday about the federal disaster reimbursement process for costs of the Missouri River flood.
Thousands evacuate as river seeps into Minot ND
Nearly 12,000 expect their homes to be swamped, water levels to break 130-year-old record by up to 5 feet
West Fremont County to evacuate
Officials fear a federal levee on the Missiour River could be overtopped. The troublesome spot is located north of Hamburg, Iowa, by the Nebraska City bridge, said Mike Crecelius, the county's emergency management director.
Sirens Blare as Flooding Hits North Dakota
Although the Fort Calhoun plant is surrounded by an eight foot tall and 16 foot wide protective berm, two feet of water have already made its way to several areas of the Fort Calhoun plant, but authorities say there is no immediate danger at either plant...
Scientists Warn Newly Discovered Fault Could Burst Dam, Destroy Reno And Kill Hundreds of Thousands
Scientist from the U.S. Army Corps of Engineers using laser imaging technology have discovered a new fault line just 200 yards away from the Martis Creek Dam in California.
Just another brick in the wall : UN Agenda 21 in US law
Let me lay this out for you in a simple way, so that maybe you can get the gist of what is really going on and how through incremental legislation EVERYTHING is being taken away from us. (*Cave Editor's note: seize all water rights, coastal and in-land, etc.)
Underwater Body Bags (DHS) New Madrid Fault area - Note the date of the request: OCTOBER 27, 2010
Remember they had ordered lots of underwater body bags?
Fear of Terror Makes People Stupid
As I've repeatedly noted, FBI agents and CIA intelligence officials, constitutional law expert professor Jonathan Turley, Time Magazine, and the Washington Post have all said that U.S. government officials "were trying to create an atmosphere of fear in which the American people would give them more power".
NUCLEAR ISSUES
Fort Calhoun plant may store spent fuel rods permanently
Washington County, Nebraska - October 5, 2009 - "When the Fort Calhoun station was designed, the pool used to store spent fuel was never intended to be a permanent storage site. The same is true for the dry cask storage facility we use. It was not designed with the intent to be a permanent solution," Jones said.
GAO: leaks at aging nuke sites difficult to detect
U.S. nuclear power plant operators haven't figured out how to quickly detect leaks of radioactive water from aging pipes that snake underneath the sites - and the leaks, often undetected for years, are not going to stop, according to a new report by congressional investigators.
Virginia nuclear reactor shuts down — Problem detected in cooling duct
A Virginia Dominion Power spokesman said Tuesday the utility has aborted efforts to restart the unit, which has been out of service since an April 16 tornado knocked out electricity.
Radiation bombards reactors, make them brittle
In certain emergencies, these vessels would flood with cooling water. If the vessel walls are too brittle, they could shatter and spew their radioactive contents into the environment.
Fukushima Nuclear Fuel Leaking Into Groundwater, Tepco Says Barrier Too Expensive, Will Hurt Stock Price
TEPCO so far is refusing to do so because the cost of the project will be over 100 billion yen. TEPCO is debating whether containing the radiation is worth more than its stock price.
Whereabouts of 30 nuclear power plant subcontractors unknown
"We don't know why there is no record of the workers. The records and dosimeters were managed by TEPCO and its administration can only be described as sloppy," a representative of the ministry's Labor Standards Bureau said.
IAEA criticizes Japan's nuclear data sharing
A Japanese official quoted an expert from the World Meteorological Organization as saying the group was unable to obtain necessary information from Japan. He said this led to difficulties in projecting how radioactive materials would spread around the world...
MORE NEWS....
http://www.thepowerhour.com/news.htm
http://www.thepowerhour.com/schedule.htm
ARCHIVE OF RADIO SHOWS
http://www.gcnlive.com/programs/powerHour/
Listen "On Demand"
Wednesday, June 22, 2011
US ARMY corp of engineers | News Releases - June 22, 2011

Fort Randall Dam to release record amounts of water from flood release tunnels
06/22/2011
Portions of the Nebraska Tailwaters Campground will be closed due to increased flows into the area
06/22/2011
Radiation Network Update on June 22, 2011 at 8:10 PM (website is real-time)

Omaha - 8:10 pm 37 cpm (2 nuke plants with flooding Missouri River)
NOW: Omaha 8:17 PM 30 cpm
San Francisco 8:10 PM- 37 cpm
*Click link to see live continuing updating map for your location - updated
CPM = Counts Per Minute
From Radiation Network: The numbers represent radiation Counts per Minute, abbreviated CPM, and under normal conditions, quantify the level of background radiation, i.e. environmental radiation from outer space as well as from the earth's crust and air. Depending on your location, your elevation or altitude, and your model of Geiger counter, this background radiation level might average anywhere from 5 to 60 CPM, and while background radiation levels are random, it would be unusual for those levels to exceed 100 CPM. Thus, the "Alert Level" for the National Radiation Map is 100 CPM, so if you see any Monitoring Stations with CPM value above 100, further indicated by an Alert symbol over those stations, it probably means that some radioactive source above and beyond background radiation is responsible.
Magnetosphere, HAARP Fluxgate Magnetometer, Solar. Moon & Earthquake Update - June 22, 2011
 YOU TUBE LINK - http://www.youtube.com/user/CaveNews?feature=mhum#p/u/0/NZy_GMKzuGk
http://www2.nict.go.jp/y/y223/simulation/realtime/index.html
ALASKA'S HAARP FLUXGATE MAGNETOMETER
http://137.229.36.30/cgi-bin/magnetometer/gak-mag.cgi
SOLAR UPDATE | SOLARCYCLE24.COM
Solar activity is very low and the chances for strong solar flares are very low.

http://earthquake.usgs.gov/earthquakes/recenteqsww/Quakes/quakes_all.php
Update time = Thu Jun 23 0:27:26 UTC 2011
| | MAG | UTC DATE-TIME y/m/d h:m:s | DEPTH km | Region |
|---|---|---|---|---|
| MAP | 3.3 | 2011/06/22 23:44:00 | 42.7 | KODIAK ISLAND REGION, ALASKA |
| MAP | 3.4 | 2011/06/22 22:34:38 | 31.1 | FOX ISLANDS, ALEUTIAN ISLANDS, ALASKA |
| MAP | 5.2 | 2011/06/22 22:16:56 | 554.3 | FIJI REGION |
| MAP | 2.8 | 2011/06/22 22:05:00 | 78.1 | ALASKA PENINSULA |
| MAP | 6.7 | 2011/06/22 21:50:48 | 32.0 | NEAR THE EAST COAST OF HONSHU, JAPAN |
| MAP | 5.1 | 2011/06/22 20:43:48 | 10.6 | OFF THE EAST COAST OF HONSHU, JAPAN |
| MAP | 3.1 | 2011/06/22 20:00:16 | 6.3 | NEVADA |
| MAP | 3.3 | 2011/06/22 19:59:51 | 7.1 | NEVADA |
| MAP | 4.3 | 2011/06/22 16:58:50 | 234.1 | EASTERN SEA OF JAPAN |
| MAP | 2.8 | 2011/06/22 16:37:59 | 55.4 | VIRGIN ISLANDS REGION |
| MAP | 2.5 | 2011/06/22 15:49:50 | 128.2 | CENTRAL ALASKA |
| MAP | 4.7 | 2011/06/22 15:48:28 | 41.8 | WESTERN XIZANG |
| MAP | 5.2 | 2011/06/22 14:28:59 | 40.9 | NEAR THE EAST COAST OF HONSHU, JAPAN |
| MAP | 5.3 | 2011/06/22 13:57:31 | 163.4 | CATAMARCA, ARGENTINA |
| MAP | 4.7 | 2011/06/22 11:55:59 | 51.7 | WESTERN XIZANG |
| MAP | 4.6 | 2011/06/22 11:35:10 | 38.5 | NEAR THE EAST COAST OF HONSHU, JAPAN |
| MAP | 2.7 | 2011/06/22 11:33:51 | 10.0 | BAJA CALIFORNIA, MEXICO |
| MAP | 2.8 | 2011/06/22 10:54:57 | 6.1 | OREGON |
| MAP | 2.8 | 2011/06/22 10:33:38 | 50.9 | DOMINICAN REPUBLIC REGION |
| MAP | 3.4 | 2011/06/22 10:30:25 | 10.0 | BAJA CALIFORNIA, MEXICO |
| MAP | 3.0 | 2011/06/22 10:28:48 | 24.7 | DOMINICAN REPUBLIC REGION |
| MAP | 2.7 | 2011/06/22 10:07:30 | 7.9 | ST. LAWRENCE VALLEY REG., QUEBEC, CANADA |
| MAP | 2.9 | 2011/06/22 07:37:33 | 87.1 | PUERTO RICO REGION |
| MAP | 3.7 | 2011/06/22 07:18:47 | 38.4 | PUERTO RICO REGION |
| MAP | 2.6 | 2011/06/22 05:08:38 | 34.9 | PUERTO RICO REGION |
| MAP | 4.8 | 2011/06/22 04:45:13 | 2.4 | RYUKYU ISLANDS, JAPAN |
| MAP | 3.2 | 2011/06/22 03:20:24 | 5.9 | SOUTHEASTERN ALASKA |
| MAP | 3.1 | 2011/06/22 02:00:27 | 18.8 | BAJA CALIFORNIA, MEXICO |